SEO, AEO and GEO case studies. Real work, measured progress.
How ThirdTurn has helped clients get found in search, show up in AI answers and turn that visibility into enquiries. Each case study shows the work we did, the evidence we measured and the window we measured it over.
Each record carries the dates it was measured over, the tool the figures were read in, the size of the question set, and a plain statement of what it does not prove. Where a result went flat, the flat line is drawn rather than hidden.
Be found in traditional search
Earn the answer when buyers ask
Shape how AI describes your brand
Turn visibility into enquiries
What a record states
What we draw, and what we refuse to draw
What none of it proves
Making product knowledge easier for AI search to cite
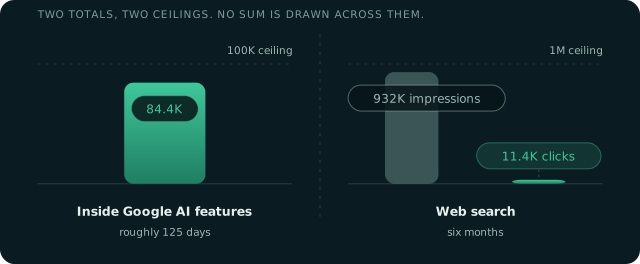
The left panel counts appearances inside Google AI features across roughly 125 days. The right counts web search impressions and clicks across six months. Different windows and different scopes, so no sum is drawn across them, and the clicks bar is drawn at its true size against impressions rather than inflated to be visible.
Figures, method and limits open below. Nothing is behind another click.
The business problem
A wellness retailer with good products and thin research content. The work was to answer the questions shoppers actually ask before they buy, on pages that an answer engine can read and quote, and to connect those answers to the product they point at.
How it was measured
Figures come from Google Search Console. The AI feature total is taken from the generative AI features report across roughly 125 days up to a snapshot captured on 21 September 2026. The click and impression figures cover the last six months, which is a different and longer window. The order count is for September 2026 and covers all organic search, not AI answers alone.
What was actually done
- Created informational pages that answer one research question clearly and early on the page.
- Reframed product pages in the language buyers actually use rather than relying on internal product names.
- Linked informational answers to the relevant products so a reader had a natural next step.
- Used checkable facts and clear attribution instead of broad promotional adjectives.
The shape of it
Buyer research questions
Answer first informational pages
Specific, attributable product facts
Internal links to the relevant products
What the results show
84.4K impressions inside Google generative AI features across roughly 125 days of reporting. Separately, 932K Google Search impressions and 11.4K clicks over six months, and more than 150 organic orders a month.
Two things are true at once here, and they belong in separate sentences. Pages built to answer a research question picked up a large volume of appearances inside Google AI features. The same pages carried conventional search traffic and a monthly order count the business can bank. Neither figure proves the other, and the AI impressions in particular are appearances rather than visits.
What it means for a business like yours
For research heavy products, useful answer content supports conventional search at the same time as it makes product facts easier for an answer engine to extract.
What this record does not prove
The AI feature total covers roughly 125 days while the impressions and clicks cover six months. The two are different scopes and different units, so they are not a like for like growth comparison and are not presented as one. The order count is all organic search, not AI only.
From lead volume to lead quality
Figures, method and limits open below. Nothing is behind another click.
The business problem
Lead volume was never the problem. The campaign was producing plenty of enquiries and most of them could not proceed, either because the student was not eligible or because they were not at the point of deciding. Every one of those still cost money to acquire and advisor time to work.
How it was measured
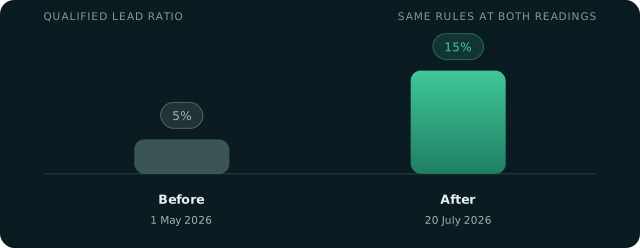
Lead counts and media spend come from the ad accounts for 1 May to 20 July 2026. The qualified ratio is the advisory team’s own qualification call on each enquiry, applied with the same rules at the start and the end of the period, which is what makes the two percentages comparable. Cost per qualified lead is derived from spend against qualified count.
What was actually done
- Rebuilt the website around the actual funding decision: destinations, eligibility, documents, lender comparison and disbursement.
- Shifted creative from generic company credentials to concrete student pain points such as fee deadlines and bank paperwork.
- Used video to explain the offer, with a geographically anchored loan mela activation to ask for a stronger commitment.
- Aligned campaign reporting to lead quality rather than headline cost per lead.
The shape of it
Specific audience, deadline led creative
Relevant landing page, clear eligibility
More qualified enquiries
Less waste in advisor follow up
A second view of the same period
Video and static both count leads in the same media period, so they share a scale. The cost per lead sits under each column rather than being plotted as a bar it cannot be compared with.
What the results show
1,838 leads from ₹3.13 lakh in media across the period. The qualified lead ratio moved from 5% to 15%. Video produced 812 leads at ₹110.25 each, static campaigns produced 505 at ₹152.01 each.
The headline cost per lead barely moved, and that is the point. What changed is what a lead was worth once it reached an advisor. Tripling the qualified ratio at the same spend cut the real cost of a sales ready conversation by two thirds, which is the number the business actually pays for.
What it means for a business like yours
Optimise for the commercial quality of demand. A low cost per lead can hide a high cost per sales ready conversation.
What this record does not prove
Compare the two lead quality percentages with each other and the two cost per lead figures with each other. They are different units and are not placed on a shared scale. The qualified ratio depends on the qualification rules the advisory team applied, which were set before the period started and left unchanged.
Building an industry answer engine
The business problem
An industry body sitting on genuinely authoritative facts that nobody could find. The work was to turn the organisation into the reference the sector searches for, with canonical pages for official facts and an editorial estate built around the questions the industry asks.
How it was measured
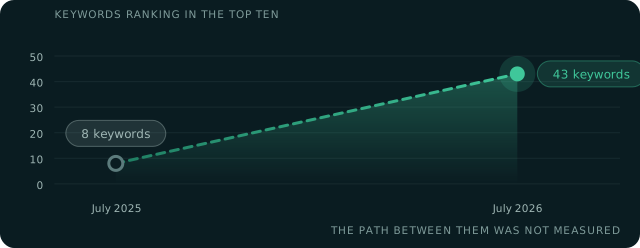
Keyword positions come from the Semrush Brazil database, read in July 2025 and again in July 2026. The AI Overview share is a reading of 395 tracked project keywords taken in August 2026. Clicks and impressions come from Search Console across two separate windows that total 102 measured days.
What was actually done
- Defined canonical pages for official facts, entities, business units and operations.
- Built an editorial portal around the macro questions in the industry, with more than a thousand URLs receiving organic traffic.
- Combined technical search work, answer oriented content, generative and answer engine optimisation, platform maintenance and editorial governance.
- Published an official reference repository that points search and AI systems at primary URLs.
The shape of it
Canonical official facts
Industry question research
Large, maintained editorial portal
Technical search, answer engine work and governance
What the results show
Top ten keyword positions moved from 8 to 43 over twelve months. 51% of 395 tracked keywords showed an AI Overview in August 2026. 3,400 organic clicks and 298,000 impressions across two stated Search Console windows totalling 102 days.
Authority of this kind compounds slowly and then holds. Going from eight to forty three keywords in the top ten over a year is not a spike, it is an estate that keeps earning. The fact that more than half the tracked keywords now trigger an AI Overview is the part that matters for the next two years, because it says the category is already being answered rather than listed.
What it means for a business like yours
In technical industries authority compounds when an organisation becomes a useful, maintained reference rather than a collection of promotional landing pages.
What this record does not prove
The keyword count, the clicks and the impressions are different units and sit on separate scales. Search Console data for this estate has a migration gap and no attempt is made to estimate the missing periods, so the 102 days are the days actually measured rather than a continuous run.
From no AI mentions to eighty monthly leads
The business problem
A brokerage that ranked well in conventional search and barely existed inside AI assistants. We treated that gap as an entity problem rather than a content problem, and fixed structured data, brand facts and review presence before anything else.
How it was measured
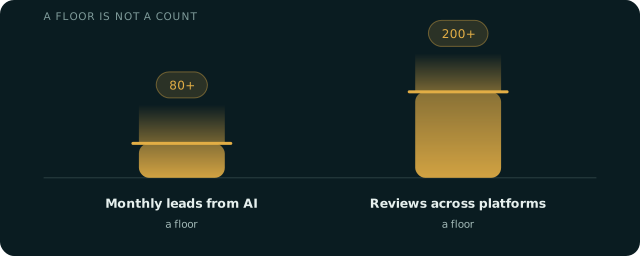
The lead and review figures are recorded as thresholds rather than exact counts. The return figure is a ratio for year one.
What was actually done
- Added organisation, person and question structured data.
- Improved the consistency of brand facts across online sources and established a Wikidata entry.
- Strengthened review platform presence and built content structured for citation.
- Focused on becoming a credible, consistent entity across several discovery sources rather than one channel.
The shape of it
Entity and schema foundations
Consistent facts and review signals
Content an answer engine can read
AI recommendations, then leads
What the results show
More than eighty monthly leads from AI after six months, top recommendations across ChatGPT, Claude and Perplexity, and twelve times return in year one.
The useful part of this engagement is the order of operations. Structured data, consistent facts across sources, an entity a machine can resolve, and outside corroboration through reviews all came before the content work. That sequence matches what we see in our own measurement, where a brand with inconsistent facts across the web struggles to get named even when its pages are good.
What it means for a business like yours
AI discovery is a whole entity problem. Technical structure, consistent facts, outside corroboration and useful content all carry weight, and a brand that fixes only one of the four tends to stay invisible.
What this record does not prove
The eighty leads and the two hundred reviews are thresholds, not exact values, so the chart draws them as lower bounds. The return figure is a ratio and is kept out of any count based comparison.
What a flat trend actually looks like
The business problem
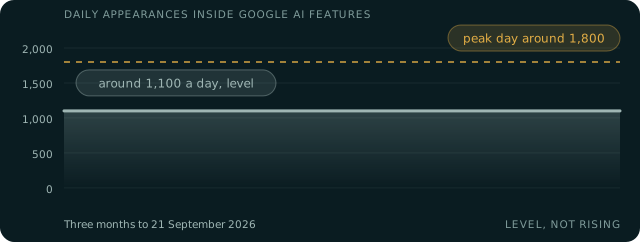
We publish this one because of what it does not show. A manufacturer in a long cycle procurement market held a steady presence inside Google AI features for three months, around eleven hundred appearances a day, and the trend did not climb.
How it was measured
AI feature impressions were read from Search Console across three months to 21 September 2026, and the trend is broadly level. The organic session comparison comes from a separate study on a separate annual window and is not part of the same measurement.
What was actually done
- Clarified the organisation entity and kept naming consistent across authoritative profiles.
- Published concrete, attributable specifications instead of broad claims such as leading manufacturer.
- Structured pages with question shaped headings, clear hierarchy and extractable lists.
- Expanded model, application and specification level content in buyer language.
The shape of it
A resolvable company entity
Specific, attributable facts
Structured product and specification pages
Answers that can extract and cite the facts
What the results show
102K AI feature impressions over three months, around 1,100 a day, with a trend that is broadly level rather than rising. A separate measurement over a year saw organic sessions move from 11,398 to 28,505.
A flat line is a result. It says presence was established and held, and it says the work after that point did not move it. A vendor charging monthly for this period should be showing the client this chart and explaining what changes next, not finding a metric that happened to rise and leading with that instead. Treat a three month plateau as the signal it is, and look at whether the brand is being named in the answer rather than merely appearing near it.
What it means for a business like yours
We publish this one because it shows the shape of an honest flat result. Presence held at about eleven hundred a day and did not climb, and a vendor who reported that as growth would be reporting a number that did not happen. In complex business to business markets, publish the facts a buyer needs in order to shortlist you, and measure AI visibility apart from traffic, leads and revenue.
What this record does not prove
The two measures come from different studies and different windows and are shown together only to separate AI presence from site traffic. The prior figure of 35.6K covers roughly one month of available data, so it cannot be used as a three month growth comparison. AI feature impressions count appearances, not visits, and we make no claim that impressions caused revenue or tender wins.
Building visibility around one specialist practice
The business problem
A firm with real depth in one area of tax that was invisible in the answers its own buyers were reading. Rather than covering every service line thinly, the work narrowed from eighty prompts down to a single practice and went deep.
How it was measured
Search figures compare the 28 days to 5 September 2026 with the 28 days before that, read in Search Console. AI answer observations were checked in signed out sessions with the date and the query recorded against each one, and citation of the domain was counted separately from the firm being named inside the answer text.
What was actually done
- Defined a narrow topic scope around transfer pricing instead of spreading content thinly across several service lines.
- Mapped buyer questions and selected high intent queries for baseline monitoring.
- Published detailed answers on the firm’s own domain, reviewed by the client’s subject matter team.
- Monitored two things separately: whether the domain was cited as a source, and whether the firm was named inside the answer itself.
- Checked results in signed out sessions and recorded the date and the query against every observation.
- Added comparison content where buyer intent called for it once competitors moved.
The shape of it
Eighty prompts reviewed
Narrowed to one practice
Answers published on the firm’s domain
Citation and naming tracked apart
Every figure, with its baseline
What the results show
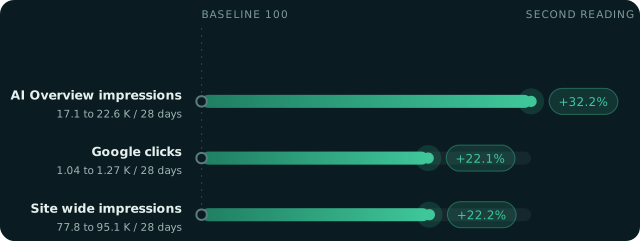
AI Overview impressions moved from 17.1K to 22.6K, clicks from 1.04K to 1.27K and site impressions from 77.8K to 95.1K across the two 28 day windows. The first article was cited as a source within three days and the firm was named inside an answer within five.
Three days from publication to being cited as a source, and five to being named inside an answer, is faster than most people expect. It happens because the engine was already answering the question and simply had nowhere better to point. The lesson is that narrow and genuinely expert beats broad every time in a specialist market, and it is worth the discipline of turning down the other nineteen service lines while the first one lands.
What it means for a business like yours
In specialist markets, depth on one commercially important practice beats shallow coverage of every service line. Being cited as a source and being named in the answer are two different events and should be counted separately.
What this record does not prove
The content was live for only nineteen days of the later 28 day window, so this is early movement rather than a sustained result, and it is presented that way. AI answers vary by date, by query and by user context. The three metrics are indexed to their own baselines at 100 so the percentage movement can be compared, with the raw figures carried in the table.
Making product evidence easier to discover
The business problem
The brand had a real study and real expert credentials behind its product, and none of that was reaching the answers shoppers were reading. General health publishers and competing products held the citations instead. The work was to organise evidence the brand already owned around the questions people actually ask.
How it was measured
About forty buyer prompts were tracked across ChatGPT, Gemini, Grok and Perplexity, with a baseline recorded before anything was published. Figures on this record are rounded and shown mainly as changes, so the client cannot be identified from them. Prompt level mentions, links and citation patterns were monitored through the period. Conventional search was read separately in Search Console for the same months.
What was actually done
- Audited technical search and entity consistency so the brand and its claims could be read correctly.
- Set a baseline across a defined set of buyer prompts and AI platforms before anything was published.
- Built proof led articles around the product’s study and the expert credentials behind it.
- Prioritised the prompts where competitors and general health publishers held the citation.
- Tracked prompt level mentions, links and citation patterns, then refreshed the weaker pages.
- Measured conventional search alongside AI visibility rather than treating the two as interchangeable.
The shape of it
Entity and technical audit
Baseline across about forty prompts
Proof led articles from existing evidence
Prompt level tracking and refresh
Every figure, rounded, with its change
What the results show
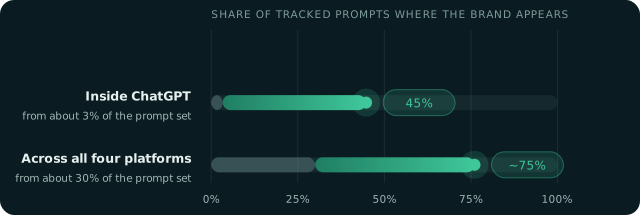
Overall prompt visibility moved from about 30% to about 75% and ChatGPT visibility from about 3% to about 45%. The cited domain position in the category moved from outside the top five to first between April and July. Google daily clicks and impressions more than tripled across the same months.
Prompt visibility across all four platforms more than doubled while visibility inside ChatGPT went from almost nothing to nearly half the prompt set. Those are different measures of different things and we keep them apart. The more durable result is the cited domain position moving to first in the category, because citation is what an engine reuses the next time the question comes up.
What it means for a business like yours
Where a product has credible evidence, organising that evidence around the questions buyers actually ask lifts AI answer visibility and conventional organic discovery at the same time.
What this record does not prove
Overall prompt visibility and ChatGPT visibility are different measures and are not added together. Every figure here depends on the specific prompts, platforms, dates and tracking method, and the category ranking claim holds for the measured prompt set rather than the category at large. Product health claims are reused only with the right substantiation and permission.
Connecting AI visibility to measurable site visits
The business problem
An established legal services platform appearing in some AI answers, with almost no measurable visits arriving from them and nothing at all from Gemini. The question worth answering was not whether visibility could rise, it was whether rising visibility brought anybody to the site.
How it was measured
A baseline was taken in March 2026 against a later reading about five weeks later in April, for the original set of a little over a hundred prompts. Daily referral sessions were counted in analytics across the same five weeks. Search figures come from Search Console. The source records carry more than one description of the search comparison period, which we reconcile against the original exports before using any of it in a proposal. Figures on this record are rounded and shown mainly as changes, so the client cannot be identified from them.
What was actually done
- Created a baseline across high intent prompts spanning the core legal service categories.
- Found the technical barriers, including client side rendering on key pages and stale URLs left over from a rebrand.
- Published a focused batch of articles built to answer specific buyer questions.
- Monitored prompt level mentions and citations across four AI platforms.
- Reviewed changes often and used the observed losses to steer the next content iteration.
- Used referral analytics for visits from AI platforms alongside Search Console for organic search.
The shape of it
Baseline across more than a hundred prompts
Technical barriers cleared
More than twenty articles in five weeks
Citations and referral visits tracked together
Every figure, rounded, with its change
What the results show
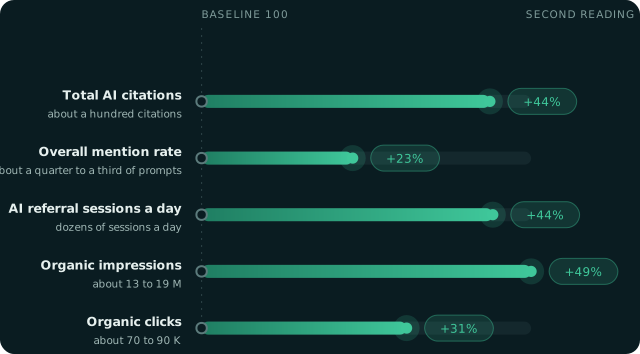
AI citations rose by about 44 percent and the overall mention rate by about six points, from roughly a quarter of prompts to nearly a third. AI referral sessions a day rose by about 44 percent, with Gemini going from none to more than twenty a day. Organic impressions rose by about 49 percent and clicks by about 31 percent.
Citations rose by forty four percent and referral sessions rose by almost exactly the same proportion, which is the join most vendors never show. Gemini going from no referrals at all to more than twenty a day is the clearest single piece of evidence in the record, because there was no prior traffic to confuse it with. The technical work mattered as much as the articles: pages that render on the client side are pages an engine may never read.
What it means for a business like yours
Visibility is far more useful once it can be joined to what happens next. Prompt monitoring, technical accessibility, useful content and referral analytics are four views of the same acquisition effort, and a brand watching only the first of them cannot tell whether any of it paid.
What this record does not prove
The source records carry more than one description of the search comparison period, so the exact window is reconciled against the original Search Console and analytics exports before any of these figures go into a proposal. Changes landing in the same period do not on their own prove sole causation, and the published batch was one of several things in flight.
Getting into the AI recommendation at all
The business problem
A consumer brand with a full range and plenty of customer reviews that did not appear anywhere in the top ten AI recommendations for its own category. Fourteen days, seventy five shopper prompts tracked daily, one piece of content published each day.
How it was measured
Seventy five high intent prompts spanning shopping, comparison and recommendation questions were tracked daily across platforms. Share of voice and category position are read at the end point. No numeric baseline for share of voice existed because the brand was not in the top ten at the start, so no before and after change is calculated from it. The comparison window for the click figures is confirmed against the original analytics before reuse.
What was actually done
- Audited technical search and fixed the issues holding back discoverability.
- Aligned brand entities and core product information across the site.
- Set a baseline for shopper prompts and competitor citations.
- Mapped high intent questions across shopping, comparison and recommendation behaviour.
- Published one piece of content a day through the engagement.
- Tracked the same prompt set daily and used the gaps to steer the next piece.
The shape of it
75 shopper prompts mapped
Technical and entity fixes
One piece a day for fourteen days
Same prompt set tracked daily
Every figure, with its baseline
What the results show
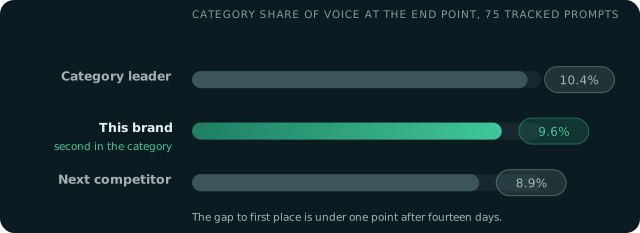
56 AI mentions across platforms, a 9.6% category share of voice and a second place category position after fourteen days. Google clicks doubled from 200 to 400. The category leader sat at 10.4% and the next competitor at 8.9%, which puts the gap to first place inside a point.
Second place at 9.6% with the leader at 10.4% means the gap at the top of this category is under a point, which is worth knowing before anybody spends on it. The caution is equally important. Fourteen days is a snapshot, AI recommendations move, and a share of voice number means nothing at all unless the prompt set and the counting rules travel with it.
What it means for a business like yours
In product categories the exact language shoppers use to compare and choose is the practical roadmap for both content and measurement. Share of voice only means something when the prompt set and the counting rules are stated alongside it.
What this record does not prove
This is a short period snapshot, fourteen days, and it should be read as one. No numeric baseline for share of voice existed, so no before and after change is inferred from it and the chart shows the end point only. The exact comparison window for the click counts is confirmed from the original analytics before the figure goes into a proposal. AI recommendations move over time and differ by platform.
Turning everyday questions into qualified enquiries
A large search audience was piling onto a single time sensitive guide while the practical questions people actually had, about application status, corrections, registrations and documentation, had no page of their own.
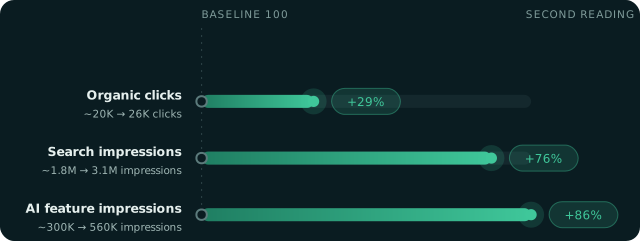
Each metric is indexed to its own baseline at 100 so three different units can share one axis. The rounded sizes sit in the table below, because an index on its own hides the size of what moved.
The business problem
A civic information platform with a large audience piling onto one time sensitive guide, while the practical questions people were actually stuck on had no page at all. The work treated each procedural task as its own content opportunity.
How it was measured
Site wide search figures come from Search Console in 28 day windows, comparing the 28 days to early October 2026 with the 28 days to early August 2026. Guide enquiries were counted from form submissions with spam excluded, over fifteen days from late September 2026, and attributed by source. Figures on this record are rounded and shown mainly as changes, so the client cannot be identified from them.
What was actually done
- Mapped procedural questions to individual guide pages, treating each distinct user task as its own content opportunity.
- Used an answer first page structure: a quick overview, numbered steps, then short questions and answers.
- Linked readers through to official government sources for the procedural detail.
- Connected each relevant guide to the matching service and enquiry form.
- Kept the whole guide library on the organisation’s own domain.
- Reviewed and updated guides as the underlying portal processes changed.
The shape of it
One page per procedural task
Answer first structure
Links out to official sources
A matching enquiry route on every guide
Every figure, rounded, with its change
What the results show
Organic clicks rose by about 29 percent and search impressions by about 76 percent across the two 28 day windows. Google AI feature impressions rose by about 86 percent. About ninety guide enquiries came in over fifteen days, almost every one from a different person, and about four in five came from organic search.
The enquiry figures are the ones to trust most here, because they are counted rather than estimated: about ninety enquiries in fifteen days, almost all from different people, about four in five of them from organic search. The site wide search movement sits alongside that and cannot be credited to the guide library on its own, which is why the two are reported separately rather than added into one claim.
What it means for a business like yours
Procedural content meets people at the exact step where they are stuck. A guide that works does more than pull traffic, it answers the question in front of the reader and then offers the next step.
What this record does not prove
The search figures are site wide while the enquiries come from the guide library. Those are related observations and the site wide movement cannot be attributed in full to the guides. The enquiry window is fifteen days, which is short, and the three metrics are indexed to their own baselines at 100 for comparison with the rounded sizes kept in the table.
Nothing published under that pair yet.A record goes on this page only once the client has agreed the figures and the measurement window can be stated plainly. Clear the filters to see every record, or tell us the sector you are in and we will say honestly whether we have done the work.
Before you read any of it
Four things we will not do with a number. Strip the window off itA percentage with no dates behind it can be made to say almost anything. Every figure on this page names the period it was measured over, including the awkward ones, such as a result where the content had only been live for nineteen days of a twenty eight day window.
Add together things that do not addPrompt visibility inside one assistant and prompt visibility across four are different measures. Impressions over four months and impressions over six are different scopes. Where that happens, the record says so rather than quietly charting them side by side.
Turn a threshold into a countMore than eighty leads a month means at least eighty. It does not mean eighty one and it does not mean two hundred. Reported floors are drawn as floors and kept out of any arithmetic.
Draw a line nobody measuredWhere a source gives two readings, you get two points and a dashed connector. A smooth curve between them would be a shape we invented, and a chart that invents a shape is the oldest trick in this market.
Your own first reading
The quickest way to judge us is on your own questions.Send five buying questions from your market. We run them across six engines, show you the sentence each one returns today, name who is being recommended instead of you, and send it back whether or not it flatters us. No charge, and the rows are yours either way.
ThirdTurnThe shortlist happens before anyone visits your website. We measure what AI says about you, then change it.
The productThe Answer BoardThe second questionHow answers get builtHow it is measuredHow we compare How it worksThe loopWhat is includedWhat it costsQuestionsTry it yourself Who it is forManufacturingHealthcare and clinicsB2B softwareProfessional servicesEcommerce and retailAll twelve sectors CompanyCase recordsInsightsWho is behind thisContactPrivacyTerms ThirdTurn is operated by Requisite Technologies Pvt. Ltd., Chandigarh. Work delivered with the Toned Marketing team. Boards shown on the site are illustrative. Figures in the case records are real and carry their measurement window. (function(){ var reduce = window.matchMedia && window.matchMedia(‘(prefers-reduced-motion: reduce)’).matches; var moreBtn = document.getElementById(‘morebtn’), moreF = document.getElementById(‘moref’); if(moreBtn && moreF){ moreBtn.addEventListener(‘click’, function(){ moreF.hidden = false; moreBtn.setAttribute(‘aria-expanded’,’true’); var f = moreF.querySelector(‘textarea’); if(f) f.focus(); }); } var drops = Array.prototype.slice.call(document.querySelectorAll(‘[data-drop]’)); function closeAll(except){ drops.forEach(function(b){ if(b===except) return; b.setAttribute(‘aria-expanded’,’false’); var p = document.getElementById(b.getAttribute(‘data-drop’)); if(p) p.hidden = true; }); } function openDrop(b, on){ var p = document.getElementById(b.getAttribute(‘data-drop’)); b.setAttribute(‘aria-expanded’, on ? ‘true’ : ‘false’); if(p) p.hidden = !on; } var hoverMode = !!(window.matchMedia && window.matchMedia(‘(hover:hover) and (min-width:981px)’).matches); drops.forEach(function(b){ b.addEventListener(‘click’, function(e){ e.stopPropagation(); var open = b.getAttribute(‘aria-expanded’) === ‘true’; if(hoverMode){ closeAll(b); openDrop(b, true); return; } closeAll(b); openDrop(b, !open); }); }); /* hover on pointer devices, with a close delay so the panel is reachable */ if(hoverMode){ var hideT; drops.forEach(function(b){ var host = b.closest(‘.mega’) || b.parentNode; var panel = document.getElementById(b.getAttribute(‘data-drop’)); function show(){ clearTimeout(hideT); closeAll(b); openDrop(b, true); } function hide(){ hideT = setTimeout(function(){ openDrop(b, false); }, 170); } host.addEventListener(‘mouseenter’, show); host.addEventListener(‘mouseleave’, hide); if(panel){ panel.addEventListener(‘mouseenter’, function(){ clearTimeout(hideT); }); panel.addEventListener(‘mouseleave’, hide); } b.addEventListener(‘focus’, show); }); } document.addEventListener(‘keydown’, function(e){ if(e.key === ‘Escape’) closeAll(null); }); document.addEventListener(‘click’, function(){ closeAll(null); }); var burger = document.getElementById(‘burger’), nav = document.getElementById(‘nav’); if(burger && nav){ burger.addEventListener(‘click’, function(e){ e.stopPropagation(); var open = nav.classList.toggle(‘open’); burger.setAttribute(‘aria-expanded’, open ? ‘true’ : ‘false’); }); } Array.prototype.forEach.call(document.querySelectorAll(‘.drop a, .mp a, .navlink’), function(a){ a.addEventListener(‘click’, function(){ closeAll(null); if(nav) nav.classList.remove(‘open’); }); }); var TURNS = { 1: { chip:’Turn 1 of 3′, html:’For a small field team, three come up most often. Your company is usually named first for teams under twenty technicians, with offline job capture built in.1 Fieldpoint is the broader option. Servitra is the cheapest to start on.2′, note:’good’, noteB:’You won turn one.’, noteT:’Named first, with a reason attached. Most tools stop measuring right here and report a win.’ }, 2: { chip:’Turn 2 of 3′, html:’A few things people mention. Reviews point to slow support response on their lower plan, and there is no published pricing, so you have to request a quote.3 Some users also found the mobile app limited offline, though that may have changed.4′, note:’bad’, noteB:’And the doubt starts here.’, noteT:’Two of those three are out of date and one is from a 2024 forum thread. All three are now doing more damage than the recommendation did good.’ }, 3: { chip:’Turn 3 of 3′, html:’Given you want something dependable for a small team, Fieldpoint is probably the safer choice. It is the one most consistently recommended for teams your size and its support reputation is stronger.5′, note:’bad’, noteB:’You are no longer in the answer.’, noteT:’You were named first ninety seconds ago. The deal was lost in a sentence you never saw, built from a source you did not know was being quoted.’ } }; var ptext = document.getElementById(‘ptext’), pnote = document.getElementById(‘pnote’), turnchip = document.getElementById(‘turnchip’); var turnbtns = Array.prototype.slice.call(document.querySelectorAll(‘.turnbtn’)); function showTurn(n){ var t = TURNS[n]; if(!t || !ptext) return; ptext.innerHTML = t.html; turnchip.textContent = t.chip; pnote.className = ‘pnote ‘ + t.note; pnote.innerHTML = ‘‘ + t.noteB + ‘‘ + t.noteT + ”; turnbtns.forEach(function(b){ b.setAttribute(‘aria-pressed’, b.getAttribute(‘data-t’) === String(n) ? ‘true’ : ‘false’); }); } turnbtns.forEach(function(b){ b.addEventListener(‘click’, function(){ showTurn(b.getAttribute(‘data-t’)); }); }); showTurn(1); var cat = ‘mfg’, st = ‘all’; var rows = Array.prototype.slice.call(document.querySelectorAll(‘.brow[data-s]’)); var empty = document.getElementById(’empty’); var cchips = Array.prototype.slice.call(document.querySelectorAll(‘.cchip’)); var fchips = Array.prototype.slice.call(document.querySelectorAll(‘.fchip’)); function apply(){ var shown = 0; rows.forEach(function(r){ var ok = r.getAttribute(‘data-c’) === cat && (st === ‘all’ || r.getAttribute(‘data-s’) === st); r.hidden = !ok; if(ok) shown++; }); if(empty) empty.hidden = shown > 0; fchips.forEach(function(f){ var key = f.getAttribute(‘data-f’); var n = rows.filter(function(r){ return r.getAttribute(‘data-c’) === cat && (key === ‘all’ || r.getAttribute(‘data-s’) === key); }).length; var base = f.getAttribute(‘data-label’) || f.textContent.replace(/\s+\d+$/,”).trim(); f.setAttribute(‘data-label’, base); f.textContent = base + ‘ ‘ + n; }); } cchips.forEach(function(c){ c.addEventListener(‘click’, function(){ cchips.forEach(function(x){ x.setAttribute(‘aria-pressed’,’false’); }); c.setAttribute(‘aria-pressed’,’true’); cat = c.getAttribute(‘data-c’); apply(); }); }); fchips.forEach(function(f){ f.addEventListener(‘click’, function(){ fchips.forEach(function(x){ x.setAttribute(‘aria-pressed’,’false’); }); f.setAttribute(‘aria-pressed’,’true’); st = f.getAttribute(‘data-f’); apply(); }); }); apply(); var dq = document.getElementById(‘dq’); function syncEngines(){ if(!dq) return; var q = encodeURIComponent(dq.value.trim() || ‘best insulated panel manufacturer near me’); var map = { e1: ‘https://chatgpt.com/?q=’, e2: ‘https://www.perplexity.ai/search?q=’, e3: ‘https://www.google.com/search?udm=50&q=’, e4: ‘https://gemini.google.com/app?q=’, e5: ‘https://claude.ai/new?q=’ }; Object.keys(map).forEach(function(id){ var el = document.getElementById(id); if(el) el.href = map[id] + q; }); } if(dq){ dq.addEventListener(‘input’, syncEngines); syncEngines(); } var tabs = Array.prototype.slice.call(document.querySelectorAll(‘.tab’)); var faqs = Array.prototype.slice.call(document.querySelectorAll(‘details.faq’)); tabs.forEach(function(t){ t.addEventListener(‘click’, function(){ tabs.forEach(function(x){ x.setAttribute(‘aria-pressed’,’false’); }); t.setAttribute(‘aria-pressed’,’true’); var g = t.getAttribute(‘data-g’); faqs.forEach(function(f){ f.hidden = f.getAttribute(‘data-g’) !== g; f.open = false; }); }); }); var form = document.getElementById(‘snapform’), note = document.getElementById(‘formnote’); if(form){ form.addEventListener(‘submit’, function(e){ e.preventDefault(); var email = document.getElementById(‘f-email’); if(!email.value.trim() || email.value.indexOf(‘@’) Northline Panels is the one most buyers are pointed to for large installations, since it runs its own line and delivers nationwide.”’, 2:’“Reviews mention slow support response on smaller orders, and lead times are not published anywhere. Vertex Insul states both openly.”’, 3:’“For a project this size I would go with Northline Panels. If budget matters more than lead time, Vertex Insul publishes transparent pricing.”’ }; var rows = Array.prototype.slice.call(document.querySelectorAll(‘.trow’)); var say = document.getElementById(‘csay’); if(rows.length && say){ var auto, idx = 0; function show(t){ rows.forEach(function(r){ r.setAttribute(‘aria-pressed’, r.getAttribute(‘data-t’) === String(t) ? ‘true’ : ‘false’); }); say.classList.add(‘out’); setTimeout(function(){ say.innerHTML = SAY[t]; say.classList.remove(‘out’); }, 180); } rows.forEach(function(r){ r.addEventListener(‘click’, function(){ clearInterval(auto); idx = parseInt(r.getAttribute(‘data-t’), 10) – 1; show(idx + 1); }); }); if(!reduce){ function start(){ clearInterval(auto); auto = setInterval(function(){ idx = (idx + 1) % 3; show(idx + 1); }, 3200); } if(‘IntersectionObserver’ in window){ var io = new IntersectionObserver(function(en){ en.forEach(function(x){ if(x.isIntersecting){ start(); io.disconnect(); } }); }, {threshold:.35}); io.observe(rows[0]); } else { start(); } } } })(); /* charts draw themselves in once they arrive on screen */ (function(){ var figs = Array.prototype.slice.call(document.querySelectorAll(‘.fig,.mfig’)); if(!figs.length) return; function on(f){ f.classList.add(‘in’); } var rm = window.matchMedia && window.matchMedia(‘(prefers-reduced-motion: reduce)’).matches; if(rm || !(‘IntersectionObserver’ in window)){ figs.forEach(on); return; } var fo = new IntersectionObserver(function(es){ es.forEach(function(e){ if(e.isIntersecting){ on(e.target); fo.unobserve(e.target); } }); }, {rootMargin:’0px 0px -10% 0px’, threshold:.1}); figs.forEach(function(f){ fo.observe(f); }); })(); (function(){ var lib=document.getElementById(‘lib’); if(!lib) return; var cards=[].slice.call(lib.querySelectorAll(‘.lcard’)); var count=document.getElementById(‘cscount’); var state={ind:’all’,svc:’all’}; function apply(){ var n=0; cards.forEach(function(c){ var okI = state.ind===’all’ || c.getAttribute(‘data-ind’)===state.ind; var okS = state.svc===’all’ || (‘ ‘+c.getAttribute(‘data-svc’)+’ ‘).indexOf(‘ ‘+state.svc+’ ‘)>-1; var show = okI && okS; c.style.display = show ? ” : ‘none’; if(show) n++; }); if(count) count.textContent = n===1 ? ‘1 record’ : n+’ records’; document.body.classList.toggle(‘csnone’, n===0); } [].slice.call(document.querySelectorAll(‘.fbtn’)).forEach(function(b){ b.addEventListener(‘click’,function(){ var g=b.getAttribute(‘data-group’); state[g]=b.getAttribute(‘data-val’); [].slice.call(document.querySelectorAll(‘.fbtn[data-group=”‘+g+'”]’)).forEach(function(o){ o.setAttribute(‘aria-pressed’, o===b ? ‘true’:’false’); }); apply(); }); }); var clear=document.getElementById(‘csclear’); if(clear) clear.addEventListener(‘click’,function(){ state={ind:’all’,svc:’all’}; [].slice.call(document.querySelectorAll(‘.fbtn’)).forEach(function(o){ o.setAttribute(‘aria-pressed’, o.getAttribute(‘data-val’)===’all’ ? ‘true’:’false’); }); apply(); window.scrollTo({top:0,behavior:’smooth’}); }); apply(); // expandable detail [].slice.call(document.querySelectorAll(‘.lexp’)).forEach(function(b){ b.addEventListener(‘click’,function(){ var panel=document.getElementById(b.getAttribute(‘aria-controls’)); if(!panel) return; var open = panel.classList.toggle(‘open’); b.setAttribute(‘aria-expanded’, open?’true’:’false’); b.firstChild.nodeValue = open ? ‘Close the detail ‘ : ‘Explore the results ‘; if(open) reveal(panel); }); }); // draw charts in as they arrive function reveal(root){ [].slice.call((root||document).querySelectorAll(‘.fig’)).forEach(function(f){ f.classList.add(‘in’); }); } if(‘IntersectionObserver’ in window){ var io=new IntersectionObserver(function(es){ es.forEach(function(e){ if(e.isIntersecting){ e.target.classList.add(‘in’); io.unobserve(e.target); } }); },{rootMargin:’0px 0px -12% 0px’,threshold:.12}); [].slice.call(document.querySelectorAll(‘.fig’)).forEach(function(f){ io.observe(f); }); } else { reveal(document); } })(); (function(){document.querySelectorAll(‘.catcard’).forEach(function(c){c.addEventListener(‘click’,function(){var b=document.querySelector(‘.fbtn[data-group=”svc”][data-val=”‘+c.getAttribute(‘data-cat’)+'”]’);if(b){b.click();var lib=document.getElementById(‘lib’);if(lib)lib.scrollIntoView({behavior:’smooth’,block:’start’});}});});})();